


Libraries: Numpy (1.5 weeks)#
Python Programming for Engineers#
Tel-Aviv University / 0509-1820 / Fall 2025-2026#
Agenda: Numpy#
Intorduction
Matrix operations
Image processing
Basic operations
Binary segmentation - Self learning
Ternary segmentation - Self learning
Image gradient
Image brightening
Morphological operators
Denoising
Matrix Operations#
import numpy#
import numpy as np
import matplotlib.pyplot as plt
import imageio.v2 as imageio
import utils.load_auxilary_files # This will load the files used for this notebook
['orders_4_2024.csv', 'witcher_2.csv', 'evil_morty_change_noised.png', 'StudentsGrades.csv', 'dog.png', 'notebook_resources.zip', 'countries-of-the-world_out.csv', 'erosion_2.png', 'dialation_2.png', 'ship.png', 'ex1.csv', 'ex2.csv', 'countries-of-the-world.csv', 'koala.png', 'orders_2_2024.csv', 'hello', 'dialation.png', '__MACOSX', 'baby.png', 'evil_morty_change_3.png', 'evil_morty_segmentation.png', 'woman_noised.png', 'orders_3_2024.csv', 'evil_morty_change.png', 'erosion.png', 'evil_morty_1.png', 'dog_noised.png', 'witcher_1.csv', 'products2.csv']
NumPy Functions#
Stacking/appending matrices vertically (add rows)#
a = np.array([[1,2,3],[4,5,6]])
b = np.array([[7,8,9],[1,1,1]])
print(np.vstack((a,b)))
[[1 2 3]
 [4 5 6]
 [7 8 9]
 [1 1 1]]
Stacking/appending matrices horizontally (add columns)#
a = np.array([[1,2,3],[4,5,6]])
b = np.array([[7,8,9],[1,1,1]])
print(np.hstack((a,b)))
[[1 2 3 7 8 9]
 [4 5 6 1 1 1]]
Image processing with numpy#
Grayscale image#
A table of integer values, aka pixels, each in the range of 0…255:#
0 = Black
255 = White

Examples for image processing tasks#
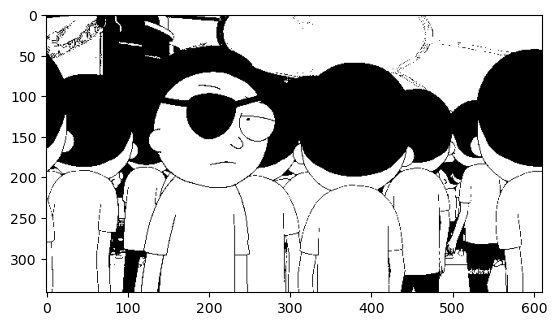
Binary segmentation
Pixel>threshold -> white, else black
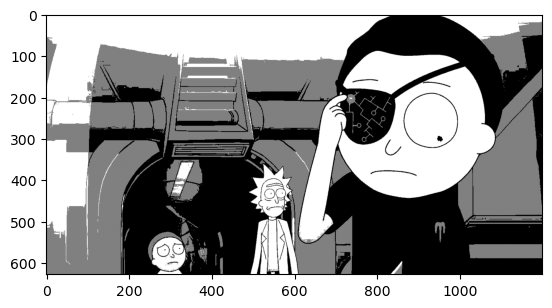
Ternary segmentation
Mapping the whole brightness range to a fixed number of values
Image gradient
Difference between neighboring pixels
Image brightening
Making each pixel brighter
Morphological operators
Erosion – more black, less white
Dilation – more white, less black
Denoising
recovering a clean image from a noisy one
All these tasks can be achieved using matrix operation!#
Image processing - basic operations#
Reading an image from disk:#
import imageio.v2 as imageio
im = imageio.imread('files/evil_morty_1.png')
print(im)

print(type(im), im.shape)
[[120 105  97 ... 201 202 203]
 [110 116 115 ... 202 201 202]
 [109 106 109 ... 200 201 202]
 ...
 [215 215 217 ... 238 238 238]
 [215 216 216 ... 238 238 238]
 [215 216 216 ... 238 238 238]]
<class 'numpy.ndarray'> (342, 611)
Creating an “empty”(?) image matrix:#
height=20
width=20

im = np.zeros((height,width), dtype=np.uint8)
Important: each pixel is in the range 0-255 (type np.uint8) #
Numerical operations cause overflow, e.g.:
Therefore, before doing numerical operations on image pixels, convert the whole image or a specific pixel to int 32-bit using np.int_
Image gradient#
Given an image we may want to locate points of major change in intensity.
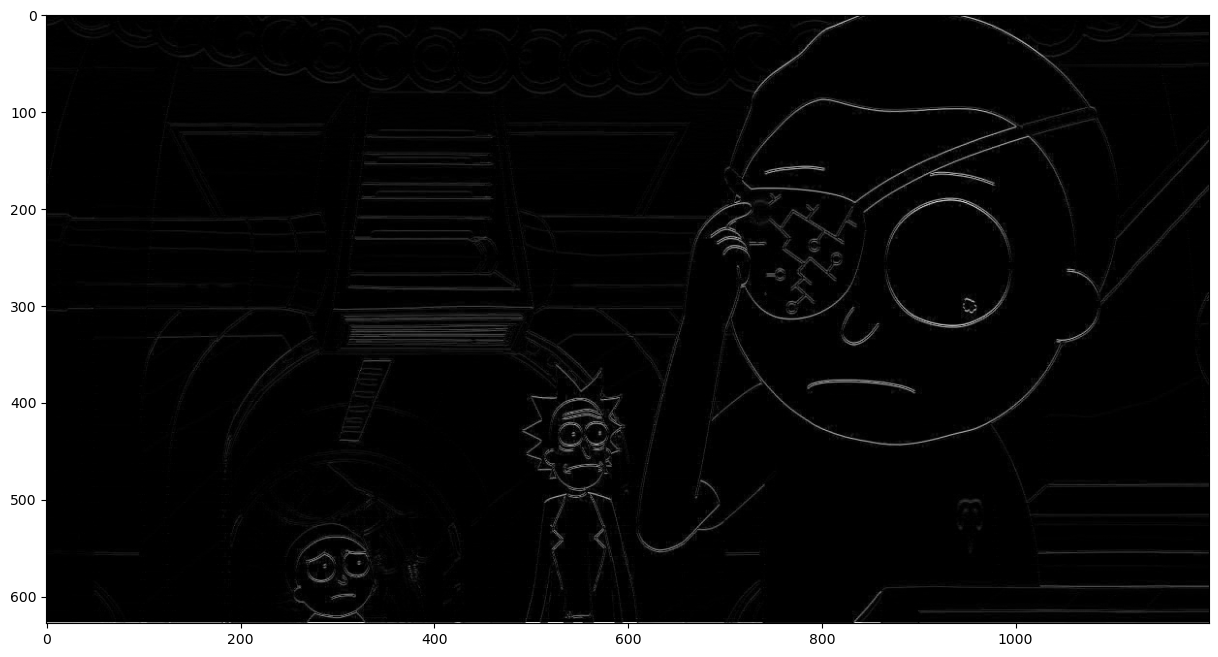
We need to create a gradient image, so that every pixel is the difference between the corresponding pixel in the original image and a neighboring pixel.
We can compute the gradient with reference to each of the image dimensions.

|

|
How do we create such an image?#
Shift up and subtract images#

Implement the function create_gradient(im) that gets an image and returns the vertical gradient image as detailed above.
hint: Create the matrix upshifted_im (im without the first row and add a row of zeros). Then create the matrix diff.
import numpy as np
import matplotlib.pyplot as plt
import imageio.v2 as imageio
im = imageio.imread('files/evil_morty_segmentation.png')
def create_gradient(im):
    pass
gradient = create_gradient(im)
plt.figure(figsize=(15,15))
plt.imshow(gradient, cmap=plt.cm.gray)
---------------------------------------------------------------------------
TypeError                                 Traceback (most recent call last)
Cell In[10], line 3
      1 gradient = create_gradient(im)
      2 plt.figure(figsize=(15,15))
----> 3 plt.imshow(gradient, cmap=plt.cm.gray)

File /opt/hostedtoolcache/Python/3.11.15/x64/lib/python3.11/site-packages/matplotlib/pyplot.py:3784, in imshow(X, cmap, norm, aspect, interpolation, alpha, vmin, vmax, colorizer, origin, extent, interpolation_stage, filternorm, filterrad, resample, url, data, **kwargs)
   3762 @_copy_docstring_and_deprecators(Axes.imshow)
   3763 def imshow(
   3764     X: ArrayLike | PIL.Image.Image,
   (...)   3782     **kwargs,
   3783 ) -> AxesImage:
-> 3784     __ret = gca().imshow(
   3785         X,
   3786         cmap=cmap,
   3787         norm=norm,
   3788         aspect=aspect,
   3789         interpolation=interpolation,
   3790         alpha=alpha,
   3791         vmin=vmin,
   3792         vmax=vmax,
   3793         colorizer=colorizer,
   3794         origin=origin,
   3795         extent=extent,
   3796         interpolation_stage=interpolation_stage,
   3797         filternorm=filternorm,
   3798         filterrad=filterrad,
   3799         resample=resample,
   3800         url=url,
   3801         **({"data": data} if data is not None else {}),
   3802         **kwargs,
   3803     )
   3804     sci(__ret)
   3805     return __ret

    [... skipping hidden 1 frame]

File /opt/hostedtoolcache/Python/3.11.15/x64/lib/python3.11/site-packages/matplotlib/axes/_axes.py:6377, in Axes.imshow(self, X, cmap, norm, aspect, interpolation, alpha, vmin, vmax, colorizer, origin, extent, interpolation_stage, filternorm, filterrad, resample, url, **kwargs)
   6374 if aspect is not None:
   6375     self.set_aspect(aspect)
-> 6377 im.set_data(X)
   6378 im.set_alpha(alpha)
   6379 if im.get_clip_path() is None:
   6380     # image does not already have clipping set, clip to Axes patch

File /opt/hostedtoolcache/Python/3.11.15/x64/lib/python3.11/site-packages/matplotlib/image.py:709, in _ImageBase.set_data(self, A)
    707 if isinstance(A, PIL.Image.Image):
    708     A = pil_to_array(A)  # Needed e.g. to apply png palette.
--> 709 self._A = self._normalize_image_array(A)
    710 self._imcache = None
    711 self.stale = True

File /opt/hostedtoolcache/Python/3.11.15/x64/lib/python3.11/site-packages/matplotlib/image.py:672, in _ImageBase._normalize_image_array(A)
    670 A = cbook.safe_masked_invalid(A, copy=True)
    671 if A.dtype != np.uint8 and not np.can_cast(A.dtype, float, "same_kind"):
--> 672     raise TypeError(f"Image data of dtype {A.dtype} cannot be "
    673                     f"converted to float")
    674 if A.ndim == 3 and A.shape[-1] == 1:
    675     A = A.squeeze(-1)  # If just (M, N, 1), assume scalar and apply colormap.

TypeError: Image data of dtype object cannot be converted to float
def create_gradient(im):
    # Create upshifted_im
    zero_row = np.zeros((1,im.shape[1]), dtype=np.int_)
    upshifted_im = np.vstack((im[1:,:], zero_row))

    # Create diff
    diff = np.int_(upshifted_im) - np.int_(im)
    abs_diff = np.abs(diff)
    return abs_diff

gradient = create_gradient(im)
plt.figure(figsize=(15,15))
plt.imshow(gradient, cmap=plt.cm.gray)
<matplotlib.image.AxesImage at 0x29399848d70>
Can it also be computed using for loops?#
Brighening the gradient#
Problem: We can hardly see the gradient image.#
let’s brighten it.
Implement the function brighten_gradient(gr) that brightens each pixel 5-fold (times 5).
This will significantly brighten every pixel that is not completely black.
def brighten_gradient(gr):
    # Write your code here
    pass
# Solution
def brighten_gradient(gr):
    brighten_gr = gr * 5
    more_than_255 = gr > 255
    gr[more_than_255] = 255
    return gr

# Better solution
def brighten_gradient(gr):
    return np.minimum(gr * 5, 255)

brighten_gr = brighten_gradient(gradient)

fig,ax=plt.subplots(1,3, figsize=(100,40))
ax[0].imshow(im, cmap=plt.cm.gray)
ax[1].imshow(gradient, cmap=plt.cm.gray)
ax[2].imshow(brighten_gr, cmap=plt.cm.gray)
<matplotlib.image.AxesImage at 0x2939992f610>

Morph by neighbors#
Morphology is a technique for the analysis and processing of geometrical structures
Morph-by-neighbors (or, morphological) operators change a pixel according to its neighborhood
|
|


Erosion#
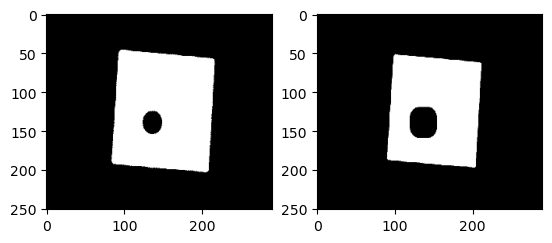
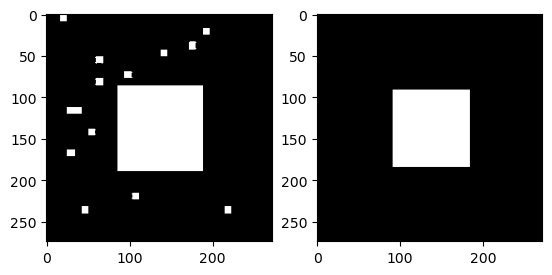
Take binary image ; produce more black, less white.
Edges of white areas (“foreground”) erode away, so black areas (“background”) grow.

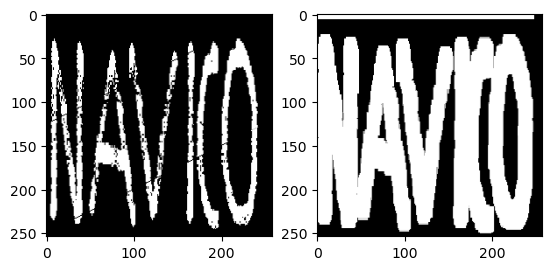
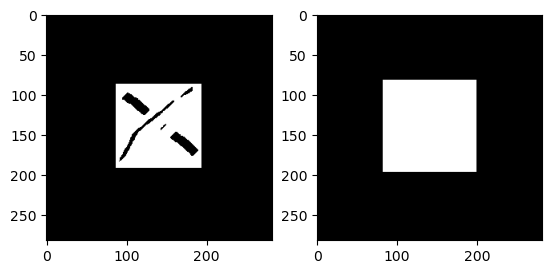
Dilation – inverse of erosion.#
Boundaries of black areas erode away, so white areas grow.

Implementation#
#Top-down design:
# the "operator" variable is a specific morph function
def morph_by_neighborhood(im, operator, dx=5, dy=5):
    new_im = np.zeros(im.shape)
    for x in range(im.shape[0]):
        for y in range(im.shape[1]):
            neighborhood = get_neighborhood(im, x, y, dx, dy)
            new_im[x, y] = operator(neighborhood)
    return new_im
def get_neighborhood(im,x,y,dx,dy):
    return im[max(x-dx,0):min(x+dx+1,im.shape[0]), max(y-dy,0):min(y+dy+1,im.shape[1])]
def erosion(neighborhood):
    return np.min(neighborhood)

def dialation(neighborhood):
    return np.max(neighborhood)
Erosion - examples#
fname="files/erosion.png"
im = imageio.imread(fname)
im_transformed=morph_by_neighborhood(im, erosion) # Can pass np.min instead of "erosion"
fig,ax=plt.subplots(1,2)
ax[0].imshow(im, cmap=plt.cm.gray)
ax[1].imshow(im_transformed, cmap=plt.cm.gray)
<matplotlib.image.AxesImage at 0x2939bb3f610>
fname="files/erosion_2.png"
im = imageio.imread(fname)
im_transformed=morph_by_neighborhood(im, np.min)
fig,ax=plt.subplots(1,2)
ax[0].imshow(im, cmap=plt.cm.gray)
ax[1].imshow(im_transformed, cmap=plt.cm.gray)
<matplotlib.image.AxesImage at 0x2939bc302d0>
Dialation - examples#
fname="files/dialation.png"
im = imageio.imread(fname)
im_transformed=morph_by_neighborhood(im, dialation) # Can pass np.max instead of "erosion"
fig,ax=plt.subplots(1,2)
ax[0].imshow(im, cmap=plt.cm.gray)
ax[1].imshow(im_transformed, cmap=plt.cm.gray)
<matplotlib.image.AxesImage at 0x2939bce8f50>
fname="files/dialation_2.png"
im = imageio.imread(fname)
im_transformed=morph_by_neighborhood(im, np.max)
fig,ax=plt.subplots(1,2)
ax[0].imshow(im, cmap=plt.cm.gray)
ax[1].imshow(im_transformed, cmap=plt.cm.gray)
<matplotlib.image.AxesImage at 0x2939bed5bd0>
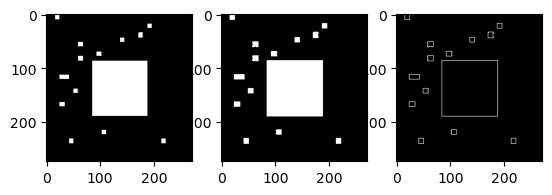
Detect Edges with Dilation#
Thicken white edges a bit, using dilation
Compute difference from original image

im1 = imageio.imread('files/erosion_2.png')
im2 = morph_by_neighborhood(im1,dialation, 1, 1)
imDiff = im2 - im1
fig,ax=plt.subplots(1,3)
ax[0].imshow(im1, cmap=plt.cm.gray)
ax[1].imshow(im2, cmap=plt.cm.gray)
ax[2].imshow(imDiff, cmap=plt.cm.gray)
<matplotlib.image.AxesImage at 0x2939bfb5a90>
Denoising#
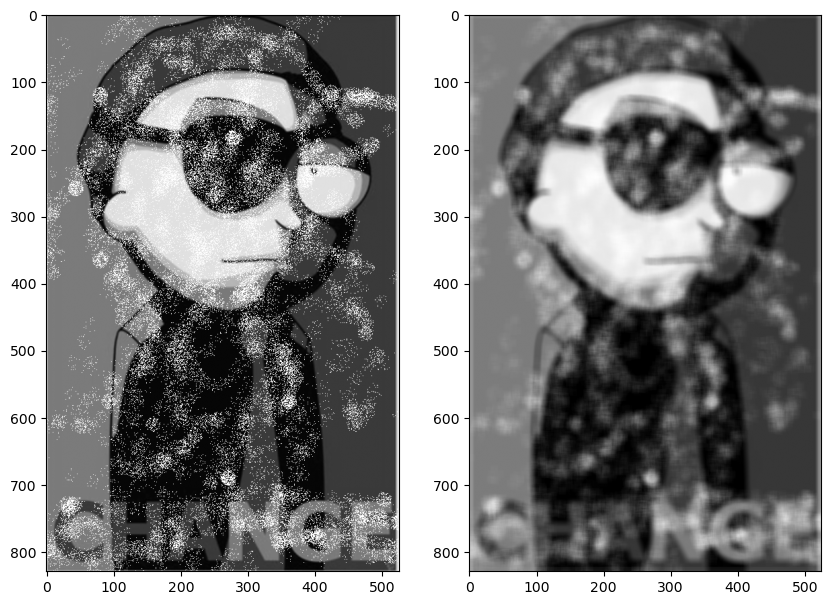
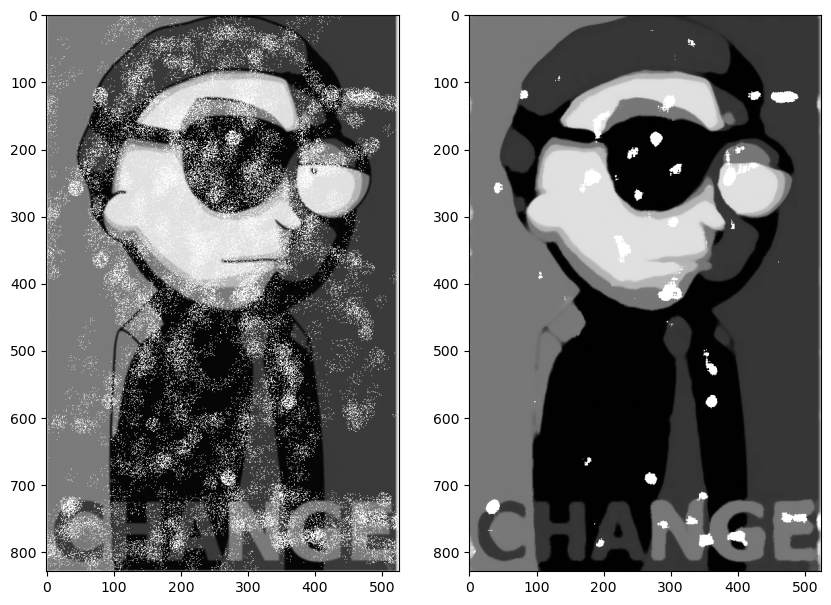
We want to “clean” this pictures from noise. Any suggestions?#

im = imageio.imread('files/evil_morty_change_noised.png')
First attempt: smoothing using mean#
Use the morph_by_neighborhood framework with mean (average):
def denoise_mean(im, dx=5, dy=5):
    return morph_by_neighborhood(im, np.mean, dx, dy)
im_transformed=denoise_mean(im)
fig,ax=plt.subplots(1,2, figsize=(10,10))
ax[0].imshow(im, cmap=plt.cm.gray)
ax[1].imshow(im_transformed, cmap=plt.cm.gray)
<matplotlib.image.AxesImage at 0x2939bd43750>
Second attempt: smoothing using median#
Use the morph_by_neighborhood framework with median:
def denoise_median(im, dx=5, dy=5):
    return morph_by_neighborhood(im, np.median, dx, dy)
im_transformed=denoise_median(im)
fig,ax=plt.subplots(1,2, figsize=(10,10))
ax[0].imshow(im, cmap=plt.cm.gray)
ax[1].imshow(im_transformed, cmap=plt.cm.gray)
<matplotlib.image.AxesImage at 0x2939c07de50>
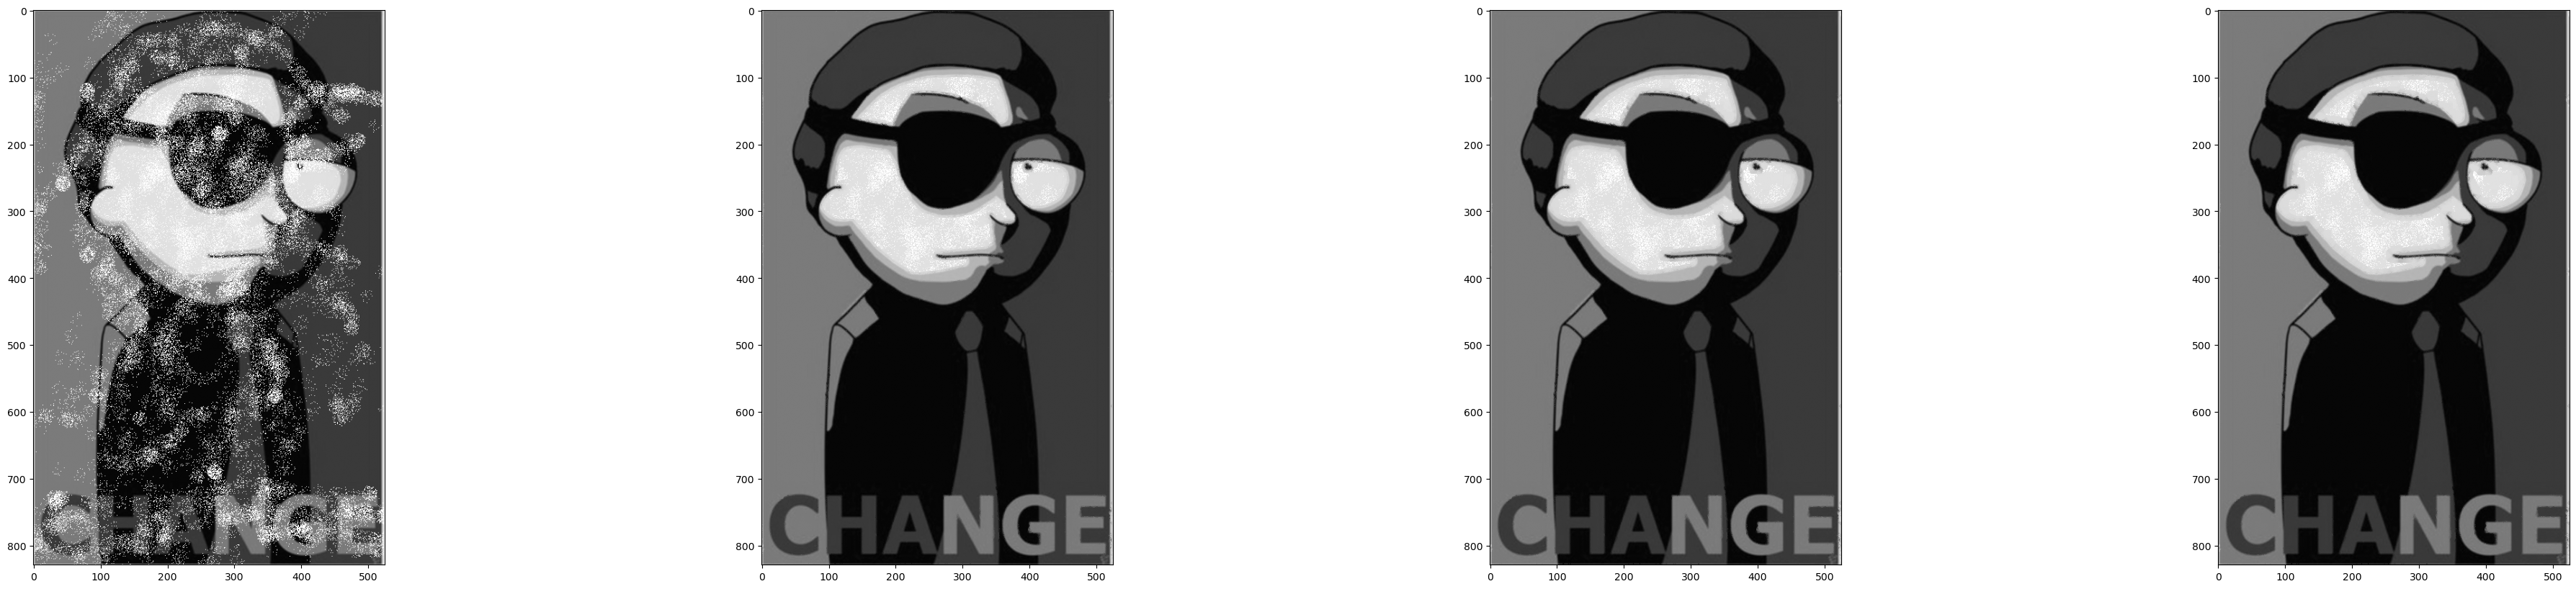
Can we do better?#
We did not exploit what we know about the ‘noise’
The ‘noise’ can only be almost white or almost black
So change only “too” bright or “too” dark pixels!
“too” bright and “too” black are determined by predefined thresholds (W, B, respectively)
solution outline#
Pixels not too bright or too dark remain with no change.
Otherwise, examine the pixel’s neighborhood neighborhood.
too dark:
Get the median of neighborhood, but ignore ‘too dark’ pixels
too bright:
Get the median of neighborhood, but ignore ‘too bright’ pixels
def my_median(nbrs, min_val=15, max_val=225):
    good_nbrs = nbrs[(nbrs > min_val) & (nbrs < max_val)]
    if good_nbrs.size>0: #There are relevant neighbors
        return np.median(good_nbrs)

    #"else": i.e., no relevant neighbors
    center = (nbrs.shape[0]//2, nbrs.shape[1]//2)
    return nbrs[center]
def clear_noise(nbrs, min_val=15, max_val=225):
    center = (nbrs.shape[0]//2, nbrs.shape[1]//2)
    if not (min_val < nbrs[center] < max_val): #Abnormal pixel
        return my_median(nbrs, min_val, max_val)

    #"else": i.e., a good one, return it
    return nbrs[center]
def denoise_bounded_median(im, dx=2, dy=2):
    fig,ax=plt.subplots(1,4, figsize=(50,10))
    ax[0].imshow(im, cmap=plt.cm.gray)
    num_repeats = 3
    for i in range(num_repeats):
        im = morph_by_neighborhood(im, clear_noise, dx, dy)
        ax[i+1].imshow(im, cmap=plt.cm.gray)
    return im
denoised_image=denoise_bounded_median(im)
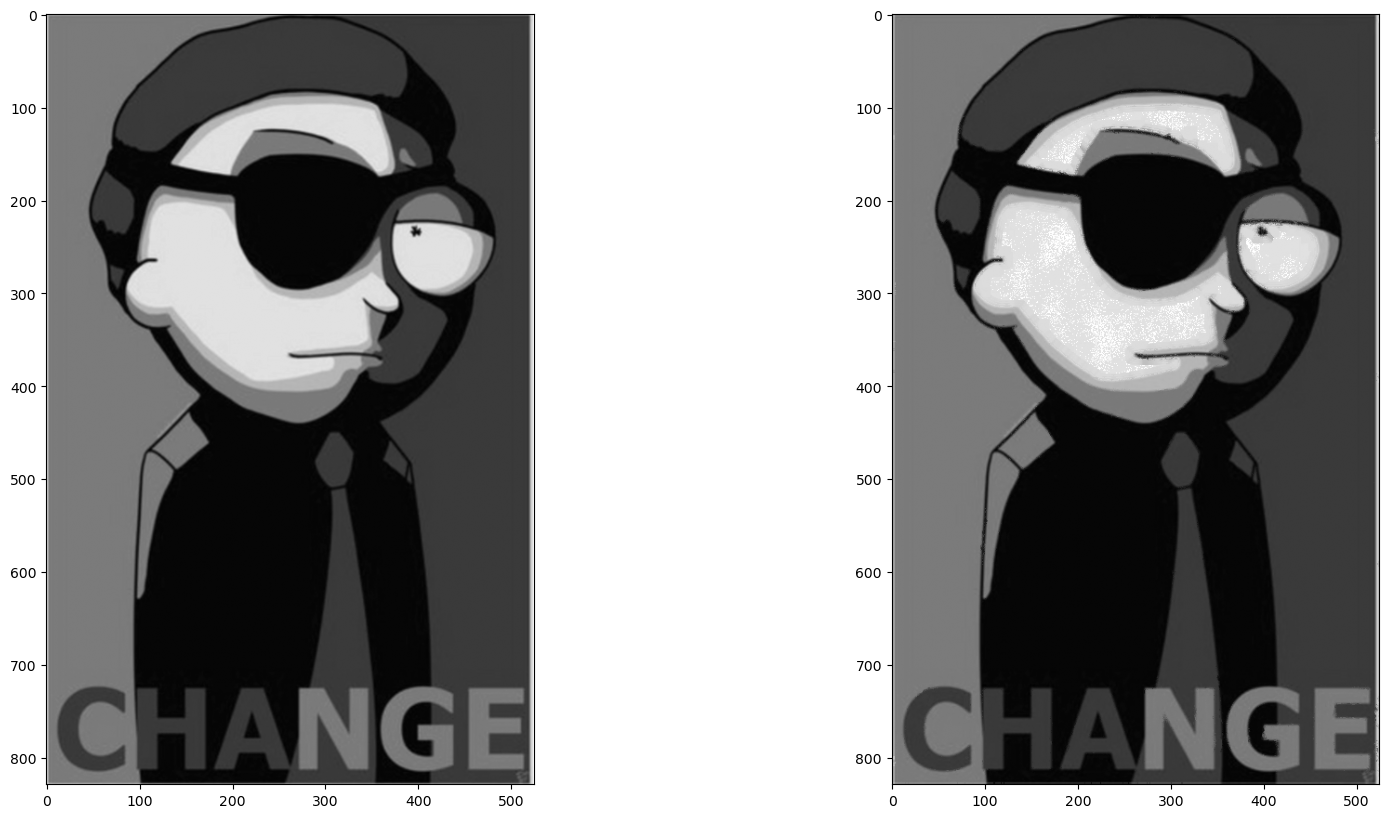
original_image = imageio.imread('files/evil_morty_change.png')
fig,ax=plt.subplots(1,2, figsize=(20,10))
ax[0].imshow(original_image, cmap=plt.cm.gray)
ax[1].imshow(denoised_image, cmap=plt.cm.gray)
<matplotlib.image.AxesImage at 0x2939dfb6490>
Self Learning#
Binary Segmentation#
Goal: grayscale image \(\rightarrow\) black and white image#
pixel > threshold \(\rightarrow\) change to white (255)
pixel <= threshold \(\rightarrow\) change to black (0)
Motivation: for example, save space#

Implementation#
def segmentation(im, threshold):
    # Write your code here
    pass
Solution#
def segmentation(im, threshold):
    # find the pixels that are > threshold
    over_threshold = im > threshold

    # make them white (255)
    binary_image = over_threshold * 255

    return binary_image

Example#
im = imageio.imread('files/evil_morty_1.png')
print(im)
[[120 105  97 ... 201 202 203]
 [110 116 115 ... 202 201 202]
 [109 106 109 ... 200 201 202]
 ...
 [215 215 217 ... 238 238 238]
 [215 216 216 ... 238 238 238]
 [215 216 216 ... 238 238 238]]
print(type(im))
print(im.shape, im.dtype)
print(np.min(im), np.max(im))
<class 'numpy.ndarray'>
(342, 611) uint8
1 255
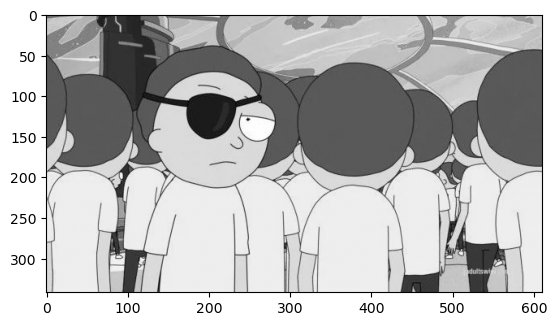
plt.figure()  # opens a new figure window
plt.imshow(im, cmap=plt.cm.gray)
<matplotlib.image.AxesImage at 0x2939def0050>
threshold = 128 #Later we’ll learn how to optimize this threshold
bin_im = segmentation(im, threshold)
Show the binary image#
plt.figure()
plt.imshow(bin_im, cmap=plt.cm.gray)
<matplotlib.image.AxesImage at 0x2939ed2bd90>
Ternary segmentation#
Ternary segmentation – like binary segmentation but with 3 values.#
Transform grayscale to black/gray/white.
First, find 2 thresholds (e.g, th1, th2) such that:
1/3 pixels turn white 1/3 turn gray 1/3 turn black
For example: If the values of the image pixels are 1 to 90 then:
first th1 = 30; th2 = 60
Then for each pixel p assign:
0 if \(p \le th1\)
128 if \(th1<p \le th2\)
255 if \(th2 < p\)

Solution outline#
We will break the problem into smaller problems:#
Find 2 thresholds from cumulative histogram.
a. Create a histogram.
b. Create a cumulative histogram.
c. Find the thresholdsTransform the image using the thresholds.
2. Assume we have a find_thrds(im) function#
(we will implement it later, don’t worry).#
Implement a ternary_segmentation function:#
Input: a grayscale image
Output: a new image where every pixel has one of 3 gray levels: 0, 128 or 255
def ternary_segmentation(im):
    pass
# Solution
def ternary_segmentation(im):
    th1, th2 = find_thrds(im)
    newIm = np.tile(0, im.shape)
    newIm[im > th1] = 128
    newIm[im > th2] = 255
    return newIm
1. Find thresholds#
1.a. Image histogram#
Implement the function build_hist(im):#
Input: grayscale image.
Output: histogram of gray levels in image.
Our histogram is list with 256 values:#
Index = gray level
Value = number of pixels with that gray level
|
|


def build_hist(im):
    pass
# Solution
def build_hist(im):
    hist = [0]*256
    for r in range(im.shape[0]):
        for c in range(im.shape[1]):
            gray_level = im[r, c]
            hist[gray_level] += 1
    return hist

#Same as:
#return np.bincount(im.flatten())
1.b. Cumulative histogram#
Implement the function cumulative sum(hist):
- Input: histogram
- Output: list of the cumulative sums of nums
 |
|def cumulative_sum(hist):
pass
# Solution
def cumulative_sum(hist):
    if not hist: return []
    result = [hist[0]]
    for i in range(1,len(hist)):
        prev_sum = result[i-1]
        result.append(prev_sum + hist[i])
    return result

#Same as:
#return [sum(hist[:i+1]) for i in range(len(hist))]
#Or:
#return list(np.cumsum(hist))
1.c. Finding the thresholds#
Given an image, find two thresholds th1, th2 such that:#
\(\frac{1}{3} \) of all pixels \(\le\) th1 \(\le \frac{2}{3}\) of all pixels
\(\frac{2}{3} \) of all pixels \(\le\) th2 \(\le \frac{1}{3}\) of all pixels
In reality, the threshold is approximated by the minimum value that is greater than the minimal fraction of pixels
Solution: use histogram + cumulative_sum#
For example: for a 5X5 image with 7 gray levels (0-6):
hist = [1,5,4,8,3,3,1]
hist_cumulative_sum=cumulative_sum(hist) # [1,6,10,18,21,24,25]
sum_of_pixels=sum(hist)
print(f'histogram: {hist}')
print(f'cumulative histogram {hist_cumulative_sum}')
print(f'{hist_cumulative_sum[1]/sum_of_pixels} < 1/3 < {hist_cumulative_sum[2]/sum_of_pixels} --> th1=2') # th1=2
print(f'{hist_cumulative_sum[2]/sum_of_pixels} < 2/3 < {hist_cumulative_sum[3]/sum_of_pixels} --> th2=3') # th1=3
histogram: [1, 5, 4, 8, 3, 3, 1]
cumulative histogram [1, 6, 10, 18, 21, 24, 25]
0.24 < 1/3 < 0.4 --> th1=2
0.4 < 2/3 < 0.72 --> th2=3

Implementation of thresholds finding#
def find_thrds(im):
    hist = build_hist(im)
    cum_lst = cumulative_sum(hist)
    i = 0
    while cum_lst[i] / im.size < 1 / 3:
        i += 1
    th1 = i
    while cum_lst[i] / im.size < 2 / 3:
        i += 1
    th2 = i
    return th1, th2
#Or simply use:
#return np.percentile(im, 33), np.percentile(im, 66)
im = imageio.imread('files/evil_morty_segmentation.png')
import matplotlib.pyplot as plt
im1_transformed=ternary_segmentation(im)
fig,ax=plt.subplots()
ax.imshow(im1_transformed, cmap=plt.cm.gray)
<matplotlib.image.AxesImage at 0x2939f0c9e50>
Question from previous exams#
Open Exam 2023-2024 semester A Moed B and answer questions 3.1 - 3.4 (including 3.4).
Solutions are shown below.
3.A
def convert_to_binary(im):
    res = np.zeros(im.shape)
    flt = im.flatten()
    bc = np.bincount(flt)
    am = np.argmax(bc)
    res[im >= am] = 255
    return res
arr=np.array([[1,2,5],[4,4,3]])
convert_to_binary(arr)
array([[  0.,   0., 255.],
       [255., 255.,   0.]])
3.B
def encode_row_helper(im_row):
    im_row_shift=np.hstack((np.array([255]), im_row))
    idxs=np.nonzero(np.diff(im_row_shift))[0]
    return idxs

def encode_row(im_row):
    idxs = encode_row_helper(im_row)
    idx_diff = np.diff(np.hstack((idxs, [len(im_row)])))
    return np.hstack(([idxs[0]],idx_diff))

im_row =[255,0,255,255]
print(encode_row(im_row))
[1 1 2]
3.C
def encode(im):
    ar = np.array([])
    for a in range(im.shape[0]):
        ar = np.hstack((ar, encode_row(im[a]), [-1]))
    return ar[:-1]

im_bin=np.array([[0,0,255,255],
[255,0,255,255],
[0,0,255,255]])
encode(im_bin)
array([ 0., 2., 2., -1., 1., 1., 2., -1., 0., 2., 2.])
3.D
def calc_ratio(im,im_enc):
    return np.sum(im_enc[im_enc != -1]) / im.size

im=np.array([[0, 1, 2, 3],
             [2, 1, 2, 3],
             [0, 1, 2, 3]])

im_bin = convert_to_binary(im)
im_enc = encode(im_bin)
print(calc_ratio(im_bin,im_enc))
1.0
Numpy: summary#
Many more operations can be performed on images, in particular:#
Numpy is very convenient library for numerical manipulations
Can be used for geometric transformations: rotation, flipping, resizing, etc.
Many application, including image processsing, which we covered thouroughly.